48-year record platinum/palladium ratio
The price ratio shows the relative value of precious metals in relation to each other and helps determine which one is more profitable at any given time.
I have already written about the history of the relationship between gold and silver from August 1971, when the United States abandoned the gold standard, to the present ( Mercenary Musing, May 9, 2016) - (see . the first, second and third parts of this material on Goldenfront here , here and here ), then I made the same selection for platinum and gold ( “Reflections of a mercenary from February 6, 2021” (Mercenary Musing, February 6, 2017) ).
Today I will talk about the prices and ratios of platinum and palladium over the past 48 years.
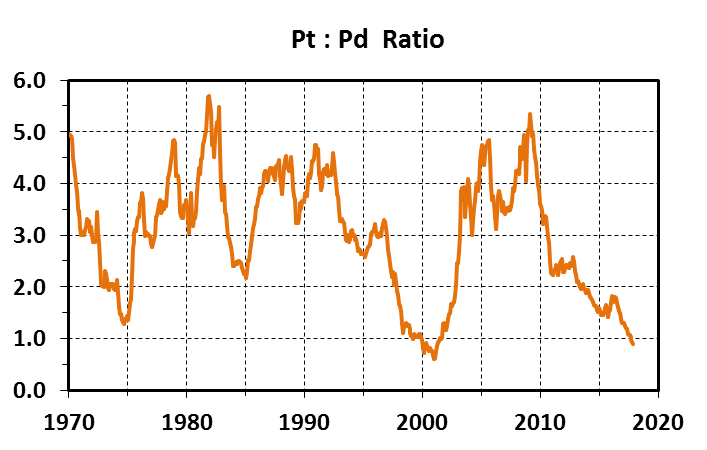
Below is a graph of average monthly prices for both metals recorded from January 1970 to December 2021. It should be noted that platinum was traded freely throughout this time, while palladium had a fixed price of $35-36/oz until mid-1972. For analysis, we will take the prices at the time of closing of the London stock exchanges indicated on the website Kitco.com .
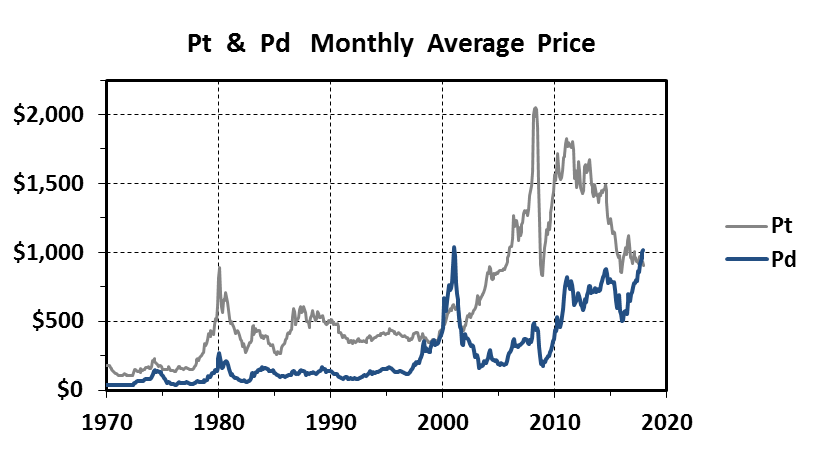
The graph shows that the price trends for platinum and palladium, as well as the correlation dependence, are the same. However, sometimes one metal exhibits greater volatility than another, both exhibit parabolic moves, but in some cases prices diverge significantly.
Over the course of 48 years, the price ratio for platinum and palladium has changed repeatedly, sometimes rising above 5.0, sometimes falling below 1.0:
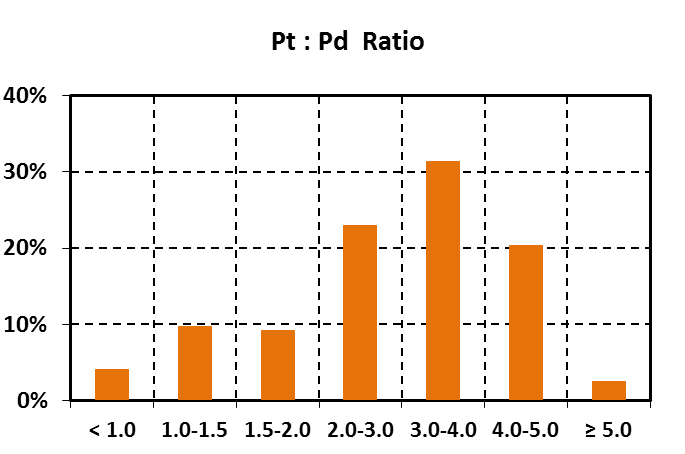
When drawing up the schedule, we took into account 576 months. Below is the distribution of the coefficient in the form of a table and graph:
Distribution of platinum to palladium ratios:
| Ratio | % months |
| < 1.0 | 4.0 |
| 1.0-1.5 | 9.7 |
| 1.5-2.0 | 9.2 |
| 2.0-3.0 | 22.9 |
| 3.0-4.0 | 31.6 |
| 4.0-5.0 | 20.3 |
| >5.0 | 2.4 |
Considering the available data and the distribution of the average monthly ratio of platinum to palladium during the period from January 1970 to December 2017, I draw the following conclusions:
- A coefficient <1.0 occurs quite rarely, in total only 23 months, and amounts to 4.0% of the entire accounting period. This ratio could be observed in April 1999, from the beginning of 2000 to mid-2001, and the last three months of 2017.
- The coefficient from 1.0 to 1.5 is 9.7%.
- From 1.5 to 2.0 - 9.2%.
- From 2.0 to 3.0 - 22.9%.
- From 3.0 to 4.0 - a little less than a third, i.e. 31.6%.
- Coefficient 4.0-5.0 is about 1/5 (20.3%) of the accounting period.
- During 14 months the ratio was >5.0 (2.4% of the reference period). These unusually high rates occurred in the last four months of 1981 and into mid-1982, as well as in the first four months of 2009.
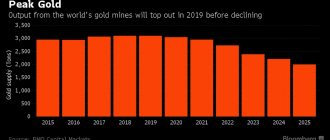
The markets for both platinum and palladium are quite small. According to the US Geological Survey (USGS), in 2015, 189 tons of platinum and 216 tons of palladium were mined in the world, and in 2021 - 176 tons and 208 tons, respectively. Compare these figures with gold production data for 2021 - 3100 tons.
Between 1990 and 2021, 4,550 tonnes of platinum and 4,800 tonnes of palladium were mined. Over the 27 years for which production data are available, the two platinum group metals markets have remained virtually equal in size.
According to various sources, the average content of both metals in the earth's crust is about 3-4 mg/t. Based on this fact alone, platinum and palladium should trade at roughly the same price. But that's not true. We see that only 6.3% of the time the coefficient is 1.0 + 0.2. Since January 1970, the average price for platinum is $633/oz, for palladium $265/oz, with an overall ratio of 2.4.
Thus, I conclude that the average abundance of metals in the Earth's crust and the relative size of markets do not affect the price ratio of the two metals.
Global production and demand have resulted in platinum trading above palladium for 96% of the period since 1970.
- Investors and jewelers prefer platinum for its higher density.
- 60% of annual platinum demand is from catalytic converters, electronics, petroleum and chemical catalysts, medical technology and other small applications. About 30% is used in the manufacture of jewelry, 10% goes to satisfy investment demand.
- Palladium is used mainly for industrial purposes, accounting for 94% of total demand. The automotive market dominates here, followed by electronics, dentistry and chemicals. Only about 5% is used in jewelry, and a small portion goes to investors.
- More than 70% of annual platinum production comes from South Africa, a country with many geopolitical risks, including labor, power, currency and black ownership. Other producers include Russia (10-12%), Zimbabwe (5%), Canada (4%) and the USA (less than 2%).
- Palladium is mined in many countries and is not as susceptible to the risks of one country. Russia and South Africa each satisfy 38-39% of global demand. Canada accounts for about 10%, 5-6% is mined in the USA, and 4% in Zimbabwe.
Large differences in the relative value of two metals are common, but very large differences are quite rare:
- From January 2000 to mid-2001, when it was said that Russia would stop supplying palladium to the West, the historically lowest ratio was observed - below 1.0, and even dropped to 0.60. Unhedged stockpiles from US automakers only made matters worse, and in just a month the price of palladium soared above $1,000/oz. But then the balance of payments in Russia was disrupted, palladium was released onto the market, and the price curve took on a parabolic shape. American auto giant Ford wrote off more than $1 billion on its inventories.
- The recent decline below 1.0 was caused by palladium supply shortages due to increased demand for gasoline-powered vehicles. Meanwhile, the economic collapse of Volkswagen caused demand for diesel to fall, and the shortage of platinum was made up by South African reserves. Over the past month, palladium has been priced above $1,000.
- Ultra-high rates (>5.0) are associated with the fall in the price of palladium below $100 in 1981-1982, as well as with the global economic crisis of early 2009, when the automobile industry collapsed. Demand for palladium fell sharply back then, but platinum prices remained stable thanks to investors viewing the metal as a safe haven.
Fluctuations in the ratio of prices for platinum and palladium are largely due to:
- the general condition and growth of the global economy, in particular the demand for gasoline and diesel engines;
- the above-mentioned geopolitical problems in South Africa, which could lead to major disruptions in platinum supplies;
- demand for gasoline-powered vehicles in the United States and China (catalytic converters use palladium) relative to demand for diesel vehicles primarily in Europe, as well as commercial vehicles, heavy equipment and generators, which primarily use platinum;
- secondary supplies of both metals, the annual volume of which is 30% - this is processing, mainly of catalytic converters; such supplies, especially for palladium, are very price sensitive, so strong fluctuations are possible;
- safe platinum reserves during times of economic instability and important geopolitical events;
- the behavior of traders and speculators on both metals exchanges (bullion exchanges, index funds and derivatives markets).
Now let's move on to the practical part.
My readers know that I believe gold is the only real currency. Gold for me is a safe haven and insurance in case of a financial crisis.
Platinum, unlike palladium, is a precious metal. During times of financial instability and economic decline, platinum is comparable to gold and is used as a store of value.
Palladium is an exclusively industrial metal; the demand for it among jewelers and investors is minimal.
The platinum to palladium ratio shows how overvalued or undervalued one metal is in relation to another. The December figure of 0.89 is a fairly rare ratio. In fact, a ratio of less than 1.0 has only been observed once before - from late 2000 to mid-2001. Also in December, the platinum-to-gold ratio was at a historically low level: <0.72.
The price of platinum is very low relative to gold and palladium, but rest assured that these relations will normalize over time.
Given the historically low ratios, I have been choosing platinum over gold for the past two years. However, please note that the premium for platinum is two to three times higher than for gold, and I always take this fact into account when making a decision.
I try to have 10-20% of my net worth in physical bullion, mostly gold, but platinum and silver are always present as well.
Physical palladium is much more difficult to purchase than platinum, so I have never considered it as an investment. Even though the price of this metal peaked at $1,117 / oz in January 2012, I still consider it more of an industrial grade than a precious metal.
Being a thrifty person, I only purchase metals during periods of declining prices, whether in a bull or bear market.
Here is my opinion and my strategy.
Support GOLDENFRONT.RU, subscribe to our YOUTUBE channel HERE .
RHODIUM
Price per gram
: $447
Color
: silver

It is the most valuable and rare metal in the world
. It was opened in 1803. Along with palladium (it was a good year for science!). The name is translated from ancient Greek as “rose”. In jewelry, rhodium is used to coat white gold or silver jewelry for added shine. The metal does not oxidize, resists corrosion and is not afraid of moisture. Sometimes you notice that white gold has turned yellow. Or the silver has “darkened”. No, the protective enamel has simply become thinner and the natural color of the metal has appeared (read how to care for rhodium-plated jewelry here).
Rhodium has always been in price. But over the past five years its value has increased 9 times. This is a record price jump. The reasons are similar to palladium. Rhodium is also used in gasoline cars. But if palladium is mined more than 250 tons per year, then rhodium is only 30 tons. Hence the explosive rise in prices. The good news is that all this leapfrog doesn’t really affect the price of the jewelry. Rings and earrings are covered with a very, very thin layer. The issue price is 50-200 hryvnia (depending on the weight of the products).
Is it possible to invest in palladium now?
We are not seeing the seventies scenario now (at least not yet).
Despite strong monetary inflation, price inflation remains relatively low (in the US). This is what is holding back the growth in demand for gold and silver.
During such times, it is useful for investors to look at other investment opportunities, including palladium. There will be more volatility, which means bigger profits. It is better to save investments in gold and silver for more difficult times. Long-term investors are advised to buy physical palladium for profit.
Supply and demand
Gold, silver, palladium and other metals respond to changes in market supply and demand.
If supply falls without reducing demand, the price rises. This is simply the law of pricing. But there is another type of supply and demand to which all precious metals respond to varying degrees. This is the supply and demand of money (in this case we are talking about US dollars, because the cost of precious metals on the international market is expressed in US dollars). If the supply (dollar money supply) rises, as it has for over 5 years, the value of precious metals rises if everything else is in balance.
If the demand for money (dollars) increases, which apparently has also been the case for more than 5 years, prices go down with other factors in equilibrium. This is one of the reasons for the correlation between palladium and other precious metals. In the long term, all precious metals are set for growth, because the money supply is constantly increasing.